Occupational Therapy Assistant Salary in Richmond, CA: $88,415 (2026)
Quick Answer:A full-time occupational therapy assistant in Richmond, CA earns a median $88,415/year (≈ $42.51/hour) in nominal terms for 2026 — projected from BLS OEWS 2025 (SOC 31-2011). Once you factor in Richmond's price level (13% above national, BEA RPP 113.1), that paycheck buys what $78,174 would nationally. Nominal pay sits 1.9% above the California state average.
Based on BLS state-level estimates · View source
In 2026, the occupational therapy assistant salary in Richmond, California, is projected to be a robust $88,415 annually, significantly surpassing the national median of $74,332. This salary reflects a spectrum that ranges from $59,452 at the lower end (P10) to $110,262 at the higher end (P90). These figures are derived from estimates based on 2025 BLS data and adjusted for regional cost considerations, which indicate a local market undergoing notable shifts, particularly in the wake of recent Medicare cuts. With various settings from skilled nursing facilities to schools and hospitals offering diverse pay structures, the job market presents various opportunities to explore.
About the Richmond Market
Salary estimated from California average ($80,000) adjusted for local cost of living.
Salary Breakdown
| Percentile | Annual | Hourly |
|---|---|---|
| Entry Level (P10) | $59,452 | $28.58 |
| Lower Range (P25) | $72,608 | $34.90 |
| Median (P50)(typical) | $88,415 | $42.51 |
| Upper Range (P75) | $97,137 | $46.70 |
| Top Earners (P90) | $110,262 | $53.01 |
Median Salary Position
18.95% above the national average
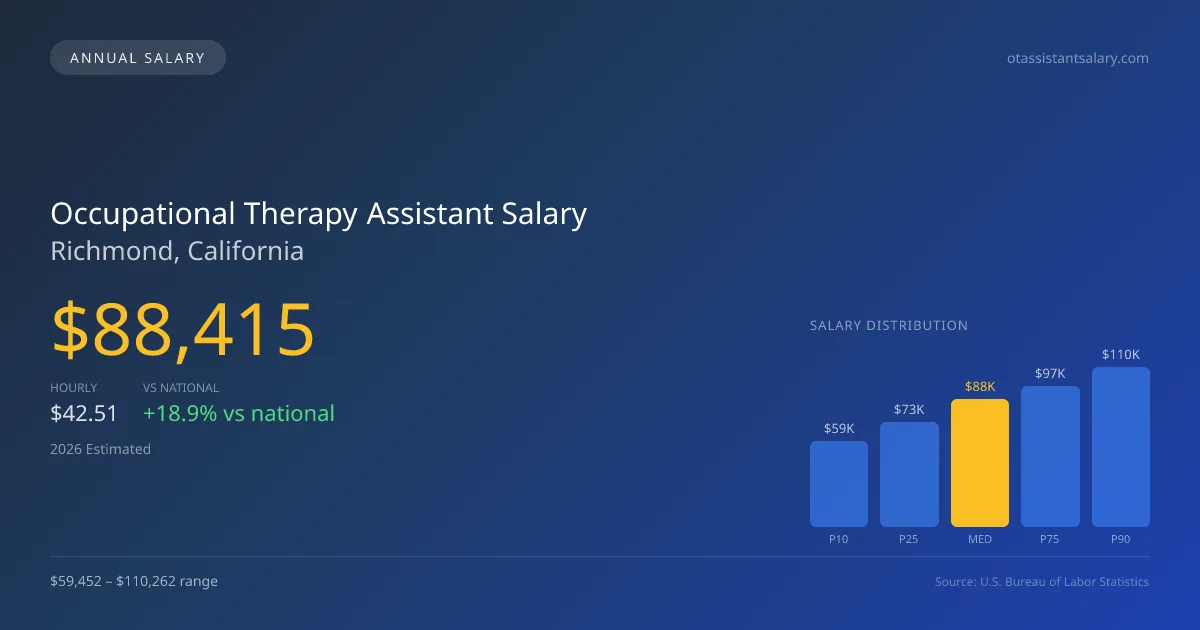
2026 Salary Percentile Distribution in Richmond
In Richmond, CA, the occupational therapy assistant salary spread from the 10th to 90th percentile is $50,810 (2026 est.). At $88,415, the local median is 18.95% above the national median of $74,332.
Salary Calculator
At 40 hours/week in Richmond: You'd be above the median
How Richmond Occupational Therapy Assistant Pay Compares
Richmond median: $88,415/year (2026)
| Compared To | Median Salary | Richmond Pays |
|---|---|---|
| California Average | $86,766 | +1.90% more |
| National Average | $74,332 | +18.95% more |
Occupational Therapy Assistants in Richmond, CA earn a median of $88,415 per year (2026 est.), which is 18.95% higher than the national median of $74,332 and 1.90% above the California state average of $86,766.
Cost-of-Living Adjusted Salary
Richmond has a cost of living 13.10% above the national average.
Adjusted salary = nominal × (100 / CoL index). CoL index: 100 = national average.
Richmond, CA has a cost-of-living index of 113.1 (above the national average of 100). While the nominal salary of $88,415 is competitive, the higher cost of living reduces purchasing power to an effective $78,174 — a 11.58% reduction.
Compare Purchasing Power
Select a city to see how your salary compares after cost of living
Select a city above to compare purchasing power
2019 BLS Actual
$73,164
2025 BLS Actual
$85,998
2026 Current Est.
$88,415
2019–2027 Growth
+24.2%
Salary Trajectory for Occupational Therapy Assistants in Richmond (2019–2027)
2019–2025: actual BLS OEWS data for this metro area. 2026+: CAGR 2.81% projection.
| Year | Annual Salary | Status |
|---|---|---|
| 2019 | $73,164 | Actual |
| 2020 | $74,865 | Actual |
| 2021 | $73,425 | Actual |
| 2022 | $76,423 | Actual |
| 2023 | $79,706 | Actual |
| 2024 | $92,193 | Actual |
| 2025 | $85,998 | Actual |
| 2026(current) | $88,415 | Estimated |
| 2027 | $90,899 | Projected |
Based on 7 years of BLS OEWS data for the Richmond metropolitan area, the median occupational therapy assistant salary grew 17.5% from $73,164 (2019) to $85,998 (2025). At a 2.81% compound annual growth rate, salaries are projected to reach $90,899 by 2027 — a total increase of $17,735 (24.24%) from 2019.
Note: Historical values (2019–2025) are actual BLS OEWS figures for the Richmond metropolitan area, sourced from annual Occupational Employment and Wage Statistics surveys. 2026–2026 figures are current estimates, and 2027 values are projections, calculated using a 2.81% CAGR derived from 7-year BLS historical data. Actual salaries may vary based on employer, experience, certifications, and local market conditions.
Salary by Experience Level
| Experience | Estimated Salary Range |
|---|---|
| 0-2 years (New Graduate) | $59,452 – $72,608 |
| 3-5 years (Mid Career) | $72,608 – $88,415 |
| 5+ years (Experienced) | $88,415 – $97,137 |
| 10+ years (Top Earner) | $97,137 – $110,262 |
OTA salary ranges estimated from BLS percentile data. Individual occupational therapy assistant compensation varies by employer, certifications, and specialization.
Occupational Therapy Assistant Job Market in Richmond
Employed professionals in this field total around 25 occupational therapy assistants in Richmond, highlighting a localized job market with specific nuances. The cost-of-living index for the area stands at 113.1, illustrating that while salaries may seem compelling, purchasing power is impacted by local expenses. Employers in Richmond, particularly in hospital inpatient rehab settings, tend to offer the highest salaries due to the more stringent productivity demands and the need for specialized care. Alternatively, skilled nursing facilities may provide lower pay, largely influenced by the 15% Medicare reimbursement cuts affecting OTA-provided services, which have compressed compensation in these settings. To maximize earnings in Richmond, prospective occupational therapy assistants should consider pursuing positions in environments that offer year-round contracts, seek opportunities in hospitals rather than schools, and strategically inquire about payment for weekend or PRN shifts, which can often yield higher hourly rates.
More salary data for Richmond, CA:
Frequently Asked Questions
How much do occupational therapy assistants make in Richmond, CA in 2026?
Is Richmond, CA a good place to work as a occupational therapy assistant?
Can occupational therapy assistants make $100K in Richmond?
What is the cost-of-living adjusted occupational therapy assistant salary in Richmond?
How much does a occupational therapy assistant make per hour in Richmond?
Related Pages
Compare Salaries
Career Resources
Nearby Cities in California
Written by Jordan Lee, MS, OTR/L
Career Analyst
Jordan Lee has 10 years of experience as an occupational therapist. Their specialty is working with children with developmental disorders. They have worked in various healthcare settings including schools and rehabilitation facilities.
Methodology & Data Source
Salary figures on this page are 2026 projections based on the Bureau of Labor Statistics Occupational Employment and Wage Statistics (OEWS) survey, May 2026 release. The BLS reported a median annual salary of $85,998 for occupational therapy assistantsin the Richmond metropolitan area. A 2.81% compound annual growth rate (CAGR), calculated from 6-year national BLS wage trends, was applied to project current 2026 compensation. Percentile ranges (P10–P90) represent the full salary distribution across experience levels and practice settings in this market.
Data Sources & Methodology
Salary data for Richmond is estimated from official BLS state-level occupational wage data (2025), adjusted for regional cost-of-living differences using BEA RPP (Regional Price Parities).
2026 figures are projected from 2025 BLS data using a compound annual growth rate (CAGR) of 2.81%, derived from historical BLS wage trends for occupational therapy assistants (SOC 31-2011).
Compiled and verified by Jordan Lee, MS, OTR/L, a licensed occupational therapy assistant with 10+ years of clinical experience. · View source data at BLS.gov